

Canada-wide marriage data · 2020
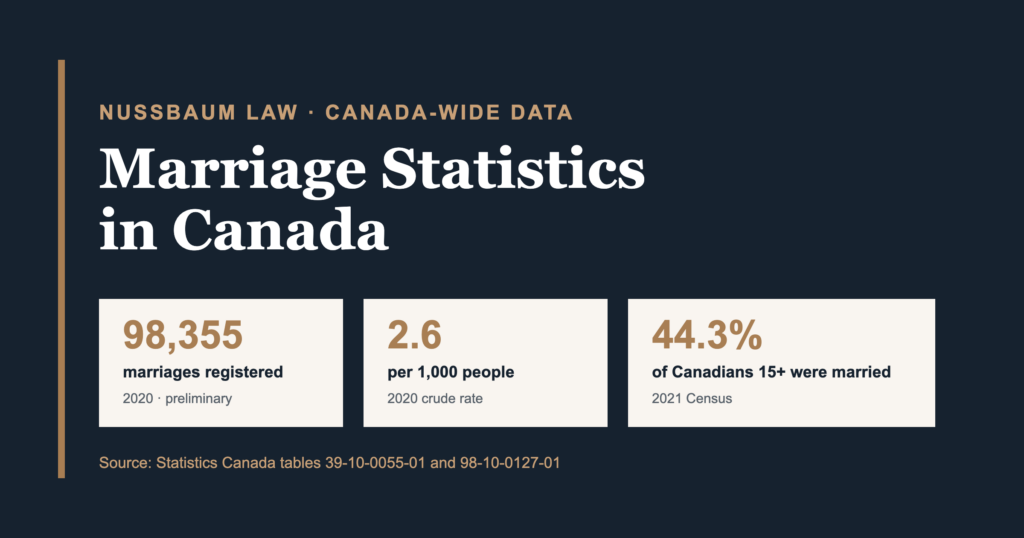
Canada registered 98,355 marriages in 2020, a rate of 2.6 per 1,000 people
The rate counts marriages registered in 2020 against Canada’s total population. Statistics Canada marks the year preliminary, and registrations fell sharply during pandemic restrictions.
Reviewed July 2026Source: Statistics Canada
Canada’s latest official marriage statistics show 98,355 marriages registered in 2020, or 2.6 marriages per 1,000 people. In 2019, before pandemic restrictions, there were 146,121 marriages at 3.9 per 1,000. The 2021 Census gives a different view: 44.3% of people age 15 and older were married and 12.6% were living common law.
Three ways to count marriage
Why marriage statistics use different numbers
A marriage count, a marriage rate and the share of Canadians who are married answer three different questions. Check what each number counts before comparing it with another year or group.
Marriages registered
Marriages registered in Canada during 2020, including non-residents who married here. It counts events, not the number of married people.
Use it to compare how many marriages take place each year.Marriage rate per 1,000 people
Marriages registered in 2020 divided by Canada’s total population, including children and people who were already married. Statistics Canada calls this the crude marriage rate.
Use it to compare marriage activity across years.Census marital status
The share of people age 15 and older who were married on Census Day 2021. Status describes who holds it at a point in time, not that year’s marriages.
Use it to describe how many Canadians are married at the Census.The age chart compares marriages with unmarried people in the same age group. The provincial chart looks only at people who were married or living common law. Each chart states the group beside the number.
National trend · 1991-2020
Canada’s marriage rate was falling long before the pandemic
Marriages per 1,000 people declined over three decades. Registrations then fell sharply during 2020, when pandemic restrictions limited ceremonies. The chart separates that sudden disruption from the longer decline.

- 1991: Series start: 172,251 marriages
- 2019: Last pre-pandemic year: 146,121
- 2020: Lowest in the series: 98,355
Source: registered marriages and marriage rates in Canada, 1991 to 2020 (Statistics Canada, table 39-10-0055-01). 2019 and 2020 are preliminary and may be underestimated; 2020 registrations fell during pandemic restrictions.
View selected chart data
| Year | Marriages registered |
|---|---|
| 1991 | 172,251 |
| 1995 | 160,251 |
| 2000 | 157,395 |
| 2005 | 147,909 |
| 2010 | 145,512 |
| 2015 | 149,256 |
| 2019 | 146,121 |
| 2020 | 98,355 |

- 1991: 6.1 marriages per 1,000 people
- 2019: Last pre-pandemic rate: 3.9 per 1,000
- 2020: Preliminary rate: 2.6 per 1,000
Source: registered marriages and marriage rates in Canada, 1991 to 2020 (Statistics Canada, table 39-10-0055-01). This rate uses Canada’s total population. 2019 and 2020 are preliminary.
View selected chart data
| Year | Per 1,000 people |
|---|---|
| 1991 | 6.1 |
| 1995 | 5.5 |
| 2000 | 5.1 |
| 2005 | 4.6 |
| 2010 | 4.3 |
| 2015 | 4.2 |
| 2019 | 3.9 |
| 2020 | 2.6 |
Canada recorded 172,251 marriages, equal to 6.1 marriages per 1,000 people.
In the last year before pandemic restrictions, Canada recorded 146,121 marriages at 3.9 per 1,000 people.
Registrations fell to 98,355 during pandemic restrictions. Statistics Canada called it a historic decline and marks the year preliminary.
Statistics Canada also estimates how likely people would be to marry if one year’s age-specific rates continued throughout their lives. That estimate fell from 73.6% in 1991 to 59.3% in 2019 and 44.4% in 2020. It is a hypothetical measure, not a forecast for real people, and the 2020 result reflects the unusual conditions of the pandemic.
Who married, and when · 2020
Average age at marriage depends on which marriages you count
One figure covers everyone who married in 2020, including people marrying again. The others cover first legal marriages only. All three come from the same official table.

- 1991: Mean 27.2, median 26.3
- 2020: Mean 31.2, median 29.8
Source: age at first marriage in Canada, 1991 to 2020 (Statistics Canada, table 39-10-0056-01). 2019 and 2020 are preliminary. Ages use estimated exact age at marriage, and legal marital status does not account for earlier common-law unions.
View selected chart data
| Year | Mean age, first marriage | Median age, first marriage |
|---|---|---|
| 1991 | 27.2 | 26.3 |
| 1995 | 28.0 | 27.0 |
| 2000 | 29.0 | 27.9 |
| 2005 | 30.1 | 28.6 |
| 2010 | 30.6 | 29.1 |
| 2015 | 31.4 | 29.8 |
| 2019 | 31.7 | 30.0 |
| 2020 | 31.2 | 29.8 |
Among unmarried Canadians, people ages 30 to 34 had the highest marriage rate in 2020: 31.5 marriages per 1,000 unmarried people in that age group, according to Statistics Canada’s marriage rates by age group (table 39-10-0057-01). Because this rate looks only at unmarried people, it cannot be compared directly with the national rate above. First-marriage ages also dipped slightly in 2020 after rising for three decades; 2020 is preliminary and was affected by pandemic restrictions.
Census status · 2021
How many Canadians are married or living common law
The Census records each person’s marital status on Census Day. These percentages cover people age 15 and older, so they answer a different question from the annual marriage count.
Looking only at Canadians age 15 and older who were married or living common law, 22.1% were living common law in 2021. In a related Census analysis, Statistics Canada reported that Canada leads the G7, with nearly one quarter of couples living common law. That analysis uses a couple-family measure, so its percentage should not be substituted for the population shares above.
The legal side is separate from the statistics. Married and common-law partners can face different property and support rules in Ontario. For the legal detail, see common-law rights in Ontario and cohabitation agreements; this page stays with the numbers.
Provinces and territories · 2021 Census
Where common-law living is most common in Canada
The chart looks only at people age 15 and older who were married or living common law. It shows where the shares differ, but the Census data does not explain why.

Source: married and common-law status by province and territory, 2021 Census (Statistics Canada, table 98-10-0127-01). The comparison includes people age 15 and older who were married or living common law.
View the full data table
| Geography | Share living common law among married and common-law people, age 15+ (%) |
|---|---|
| Nunavut | 50.3 |
| Quebec | 41.8 |
| Northwest Territories | 34.5 |
| Yukon | 31.9 |
| New Brunswick | 22.5 |
| Canada | 22.1 |
| Nova Scotia | 21.0 |
| Newfoundland and Labrador | 18.3 |
| British Columbia | 17.4 |
| Prince Edward Island | 17.3 |
| Saskatchewan | 16.5 |
| Manitoba | 16.4 |
| Alberta | 16.3 |
| Ontario | 15.2 |
Among people who were married or living common law, 50.3% in Nunavut and 41.8% in Quebec were living common law. The comparable share was 22.1% across Canada and 15.2% in Ontario. The table uses the same comparison group for every province and territory.
Limits of the data
What official marriage statistics count, and what they miss
Recorded by place of registration in the national vital statistics marriage data, including non-residents who marry in Canada.
- Canadian residents whose marriages were registered abroad
- New common-law relationships, which no registration system records
- Late registrations: 2019 and 2020 are preliminary and may be revised upward
A Census percentage is not a count of that year’s weddings, and an annual marriage count does not show how many people are currently married. Provincial figures record where a marriage was registered, which may not be where the couple lives. Statistics Canada can revise earlier values, so each figure on this page includes its reference year.
Legal planning
Marriage and common law can create different rights in Ontario
If you are planning a marriage or common-law relationship, the legal differences matter. Ontario’s property and support rules can apply differently, and an agreement can record what you and your partner decide in advance. Read about prenuptial agreements in Ontario, cohabitation agreements, and how married and common-law rights differ.
If your question is about marriages ending, including how long marriages last before a divorce, our Divorce Statistics in Canada page covers that data separately.
Sources and downloads
Where these marriage statistics come from
The newest national marriage figures available are for 2020. The 2021 Census supplies the marital-status figures, and Justice Canada’s June 2026 report reviews the same marriage trends. Chart downloads contain only the data shown on this page; the official downloads below include the full tables.
Registered marriages and marriage rates, 1991 to 2020
Registered marriages, marriages per 1,000 people and other marriage indicators from 1991 to 2020.
Open the full data tableDownload the full data (ZIP)
Mean and median age at marriage, 1991 to 2020
Mean and median age at marriage by legal marital status, 1991 to 2020.
Open the full data tableDownload the full data (ZIP)
Married and common-law status across Canada, 2021
Marital status by age group and gender, national and provincial, population age 15 and older.
Open the full data tableDownload the full data (ZIP)
Federal review of marriage trends
A federal review of marriage trends through the latest available year. This page uses only its findings about marriage.
Read the Justice Canada reportDownload the report (PDF)
Counts are rounded. Statistics Canada marks 2019 and 2020 as preliminary and potentially underestimated, and it can revise earlier values. Registrations are counted where they take place, include non-residents and exclude Canadian residents married abroad. Population shares and the provincial common-law comparison cover different groups, so this page does not treat them as the same measure. Age-specific rates come from Statistics Canada’s marriage rates by age group (table 39-10-0057-01). Pandemic context: Statistics Canada, November 2022. Common-law context: Statistics Canada, July 2022. Maintained by Nussbaum Law; the source data is checked before the review date changes. Change log: July 2026, full rebuild using official sources.